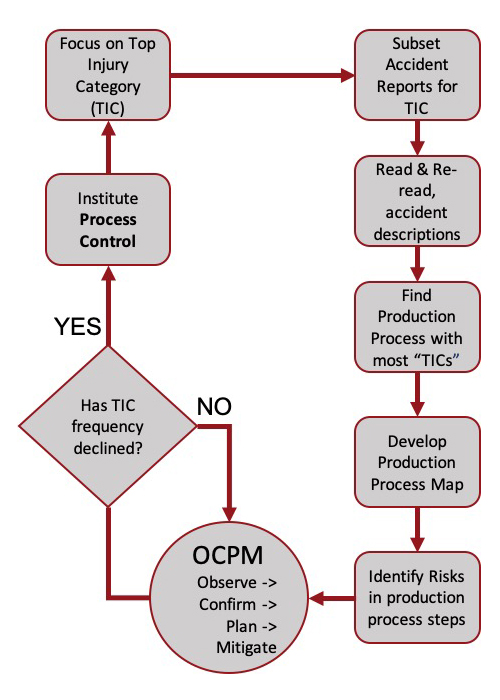
Safety Analytics is a process loop itself. To start, we obtain and display your company’s safety incident data—at least 2 years worth. Once the incident frequency and loss measures are identified via Control Chart technology as stable candidates for improvement, we can then:

Audit Your Existing Safety Processes
- We first identify the most frequent or costly incident types (called “Top Incident Category” or TIC) and hone in on the steps in your process that carry the greatest risk.
- We subset the safety incident data to only those incidents in this TIC.
- We read, re-read, and read again the incident descriptions/accident narratives to identify patterns and/or commonalities that lead to a mitigation strategy.

Increase Reliability of Data to Improve Workplace Safety
- Once we’ve identified trends, we develop a process map to reduce variation in the process and, in turn, mitigate risk.
- Observe, Confirm, Strategize, and Mitigate (OCSM)

Minimize OSHA Citations & Fines
- After testing and implementing your new mitigation strategy, we continue to measure its performance so that you can control safety risk, continue mitigating the number of incidents, and minimize OSHA citations & fines
- After one TIC has been evaluated, we identify the next TIC for improvement


 “Without data you’re just another person with an opinion.”